Organ transplants do not always work, despite accompanying treatment with immunosuppressive drugs. Sometimes the immune system accepts the foreign tissue, and other times it launches a full-fledged attack.
To better differentiate the chain of events underlying the body’s tolerance of transplanted tissue versus the events leading up to rejection, researchers have to monitor the complex behavior of T cells—a class of immune cell comprising both protective and destructive groups.
In a study with broad implications for the capacity to analyze immune responses, a team led by investigators at HMS presents a mouse model with T cell subsets that are distinctively color-coded. The different fluorescent labels allow tracking of T cell behavior in a living animal at the level of the individual cell. So researchers can see what the T cells are actually doing.
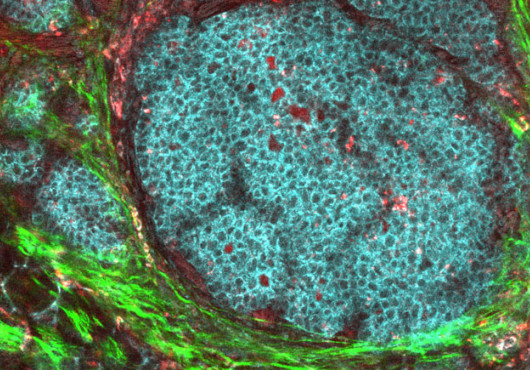
Using these mice, the team transplanted pancreatic islets (which are damaged in type 1 diabetes) beneath tissue that surrounds the kidneys. Then the researchers performed endoscopic microscopy at the transplant site and noninvasive imaging of the labeled immune cells circulating in the bloodstream. This strategy revealed new and somewhat suprising information about T cell dynamics, which could guide development of techniques for greater transplant tolerance. In the future, the strategy might be extended beyond transplant studies, perhaps to visualize T cell behavior in mouse models of diseases such as type 1 diabetes or cancer, in which the immune response is central to the pathology.
Prior to this study, it had not been possible to track immune cell subsets within living animals with single-cell resolution, said senior coauthor Terry Strom, HMS professor of medicine and director of the Transplant Research Center at Beth Israel Deaconess Medical Center. The technology that made such imaging possible was an innovation from a group led by Charles Lin, an HMS associate professor of dermatology at the Wellman Center for Photomedicine at Massachusetts General Hospital.
“The immune response to foreign proteins usually involves a mixture of various cytodestructive and at least two cytoprotective T cell subsets,” said senior coauthor Maria Koulmanda, HMS associate professor of surgery and director of nonhuman primate research in the Beth Israel Transplant Center. “The vigor and nature of the response can be fully understood only by identifying the number, frequency and molecular phenotype of the T cell subsets engaged in the immune response.”
The study appears in the June issue of Nature Medicine, with co–first authors Zhigang Fan, a research fellow at BID, and Joel Spencer of Massachusetts General Hospital.
Flying ColorsIn order to create the color-coded immune mouse that received islet transplants, the team started with a mouse genetically designed to lack T cells. Then the researchers populated its immune system with green fluorescent protein–expressing protective T cells called regulatory T cells (Tregs) and red fluorescent protein–expressing destructive T cells called effector T cells (Teffs).
In addition to identifying these two basic types of T cells, the fluorescent proteins enabled researchers to distinguish between two subcategories of Tregs that before had been nearly impossible to distinguish in living animals: natural Tregs and induced Tregs. While natural Tregs acquire their protective identity during T cell maturation in the thymus, induced Tregs are T cells that have become protective due to environmental conditions. Under certain conditions, for example, Teffs can become induced Tregs, transforming from destructors to protectors. When the red Teffs become induced Tregs, they begin to produce green in addition to red fluorescent protein. The combination of colors makes them appear yellow, distinguishing them from both red Teffs and green natural Tregs.
Population BehaviorHaving labeled these three different varieties of T cells, the team proceeded to investigate each variety’s role in the transplant response. As Strom put the question: “What is the tempo and magnitude at which these different cell types home to the transplant or appear in the circulation in mice that undergo vigorous rejection versus those that don’t undergo rejection at all?”
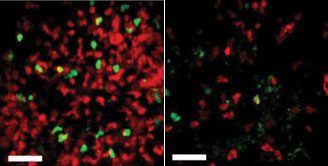
While the control group of color-coded mice rejected islet transplants after 14 days, the mice given rapamycin plus CD154 antibody—a tolerance-promoting treatment—did not. The team had expected to see a large increase in protective T cells at the graft site in these transplant-tolerating mice, since a general hypothesis in the field is that tolerance is supported by increased Treg-mediated protection. To the researchers’ surprise, however, there was no appreciable change in the number of green or yellow cells. Instead, they noted a dramatic reduction in the number of infiltrating red cells in the transplant-tolerating mice. One reasonable interpretation is that Tregs do a better job of protecting transplants when they have fewer destructive Teffs to contend with.
In addition to probing the T cell response to transplantation at a molecular level, the team expects in the future to use the color-coded mouse model to study T cell dynamics in disorders whose pathology is based on the immune response. These include autoimmune diseases and cancer. The team has already begun to study autoimmunity by applying their color-coded in vivo imaging strategy to a widely accepted mouse model of type 1 diabetes.
How will this approach guide the development of therapeutics?
“It doesn’t give you a magic treatment,” said Strom, “but it gives you a basis for determining the necessities of creating a vigorous immune response or to create tolerance.”
For more information, students may contact Terry Strom at tstrom@bidmc.harvard.edu or Maria Koulmanda at mkoulman@bidmc.harvard.edu.
Conflict Disclosure: The authors declare no conflicts of interest.
Funding Sources: The National Institutes of Health and the Juvenile Diabetes Research Foundation; the content of the work is the responsibility solely of the authors.